
Polarization in the Senate
Polarization is increasing. How does this play out in the Senate?
Code for this project can be found on Github
In our last article, we showed empirically that polarization in the American Congress in increasing. In this article, we dive deeper and explore these trends in the Senate specifically. We specify another metric, party loyalty, as a proxy value to polarization. This metric helps us further confirm our empirical findings on the trend of polarization and to answer the question: are individual Senators becoming more loyal to their party? Do Senators who are more loyal to their party stay in power longer than those who reach across the aisle?
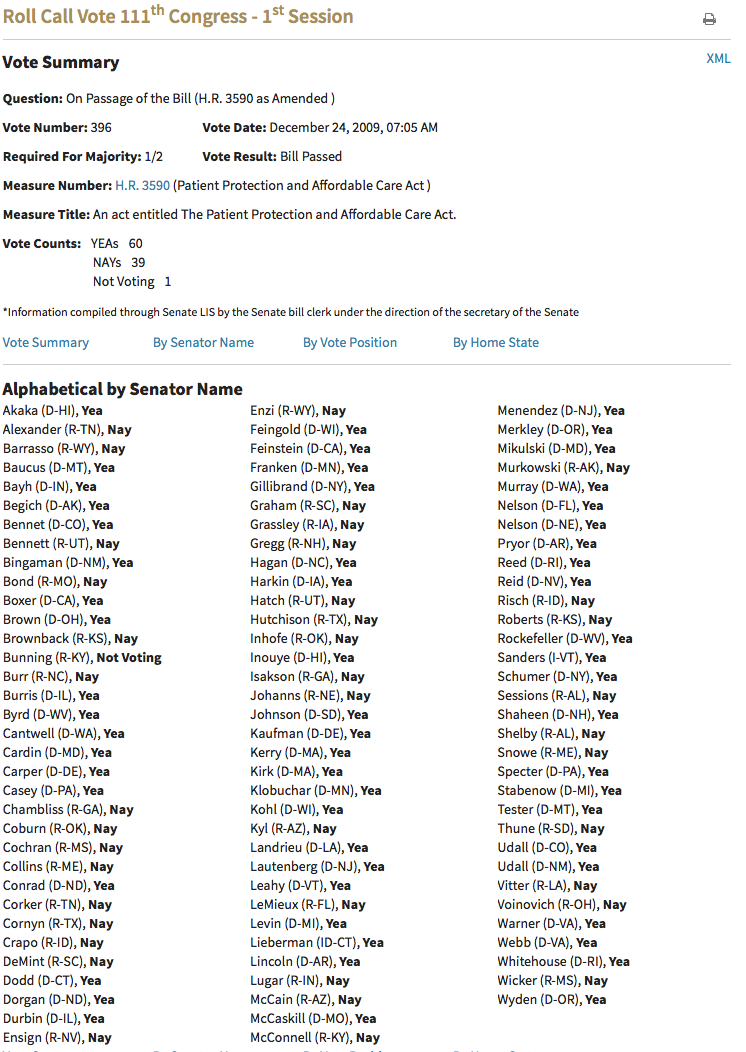
Party loyalty is defined as the percentage of Senators of a given party which votes in line with the majority of the party. To illustrate the concept we take the vote for the Affordable Care Act as an example. In this vote all Democrats voted for it, while all Republicans voted against it. The party loyalty is therefore 100% for both parties.
As can be seen from the screenshot below, which shows this result of the vote for the Affordable Care Act, we can also see the name and state of each Senator. That allows us to investigate the party loyalty for each Senator and state. The website provides us with all bills voted on in the Senate between 1989 and 2020. Having data for over 30 years gives us the possibility to investigate the dynamics over time.
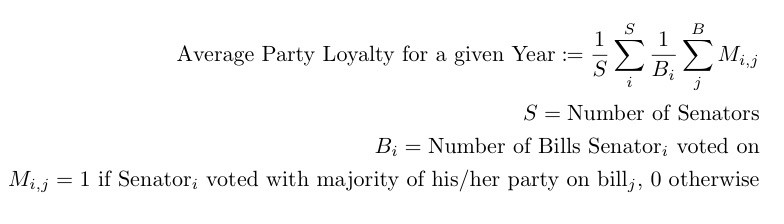
In order to calculate the average party loyalty for a given year, we proceed as follows: for every bill a Senator faces, we assign them the value1 if the voted with party majority, and a zero if they did not. Afterwards we average all these values a Senator accumulated over a years time. With that we obtain the average party loyalty of an individual Senator. If we now average the values of all Senators within a party, we get the average party loyalty of the entire party within a year. Below, a mathematical notation for this concept is given.
Furthermore, it is important to talk about what the numerical boundaries of our concept of party loyalty are. From our Affordable Care Act example, it should be clear that the maximum average party loyalty across all Senators of one party is equal to 100% or 1. That is because everybody voted in line with the majority of the party.
The lower boundary of the average party loyalty across all Senators of one party, though, cannot be any lower than 0.5. That is because how we define a party’s majority. A majority is defined as having more people voting for it than against it.
Assuming a positive even amount of Senators, N, within one party, and given the discrete nature of votes, the minimum amount of votes needed for a majority is equal to (N/2 + 1). All these Senators will, following our definition, be assigned a value of one, whereas the rest (N/2 - 1) gets assigned the zero. If we now calculate the average across all Senators we get the following equation which shows that the average value is always going to be strictly above 0.5. The mathematical notation below also shows that this holds for an uneven number of Senators within a party.
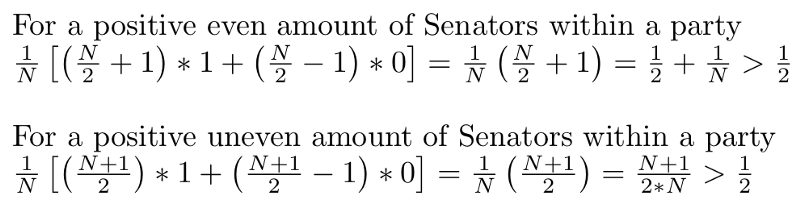
Of course we also have to address the case of an even amount of Senators where exactly half of the Senate votes one way, and the rest votes the otherway. In that case we manually set the party loyalty to 0.5.
Average Party Loyalty across all Senators and Parties over Time
Before looking into how the average party loyalty developed within each party, we start by looking into the development average party loyalty across Senators and parties. This figure is obtained by averaging the party loyalty figure of each Senator over both parties for a given year.
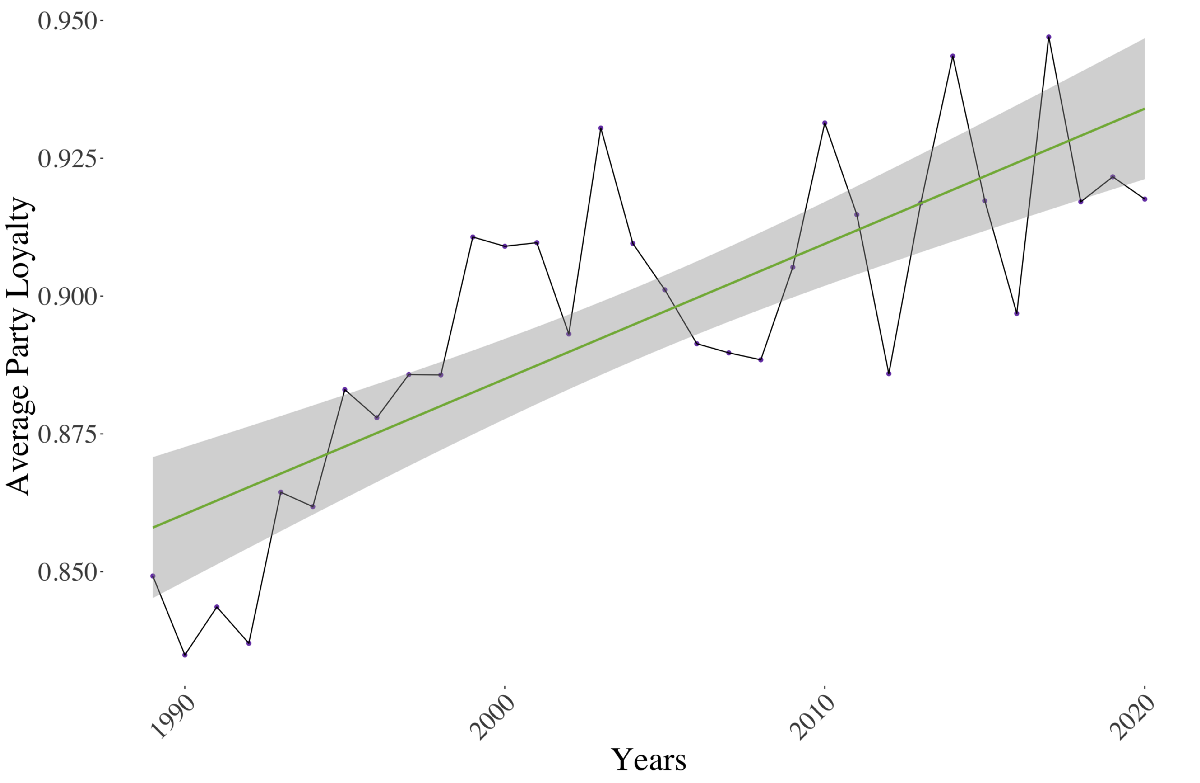
As we can see in the graph above, party loyalty has been increasing over the period of study. A regression analysis of the figure over the years, shown below, also confirms that the suspected trend is indeed statistically significant.
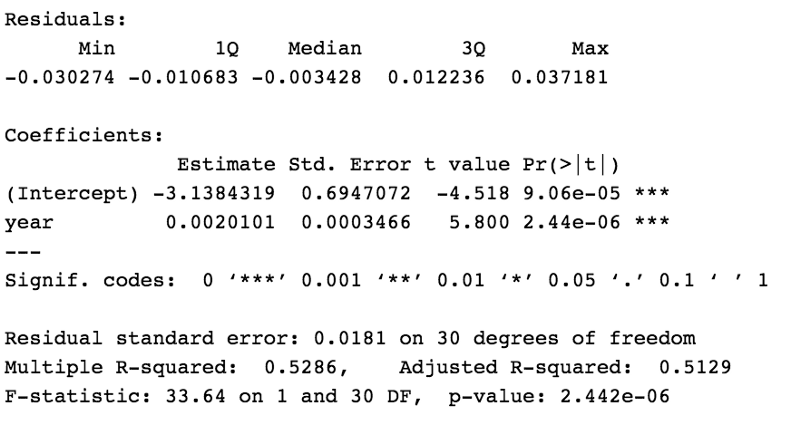
This finding is not all that surprising, given our findings of the positive slope of polarization in the US congress over time. Though, the result here serves as a valid robustness check of our previous finding.
Difference between Party Loyalty and Polarization
One might be asking now what the difference is between Polarization and Party Loyalty. The biggest benefit of party loyalty is that the figure is, unlike Polarization, applicable not only for the entire Senate as a whole but also for individual parties and even Senators.
It should be noted that it’s possible for Polarization and Party Loyalty to go the opposite way. For example, it’s possible to have high polarization coexist with high party loyalty. The Affordable Care Act is a good example for that. All Democrats and Republicans vote in line of their party.
However, it is also possible to have low polarization but high party loyalty. That case would describe a vote where both parties voted for the same thing. Here we would have low polarization, because the parties are not opposing each other, but still high party loyalty.
The case of both low polarization and low loyalty is also possible. That case would describe a vote where half of both parties would vote Yea and the respective other votes Nay. The only impossible combination is to have high polarization and low party loyalty.
In short, party loyalty and polarization tend to correlate with each other, but do not necessarily need to. The advantage of party loyalty is though that it can be analyzed on a deeper level.
Party Loyalty by State
It is widely known that politics in America differ widely by state. There are states that consistently vote Democrat, where a Republican has almost no chance of winning the Senate (like New York and California), and red states like Oklahoma and Wyoming where the opposite is true. More interesting perhaps are so-called “purple states” that have long had one Senator from each party, like Missouri, West Virginia, and Indiana.
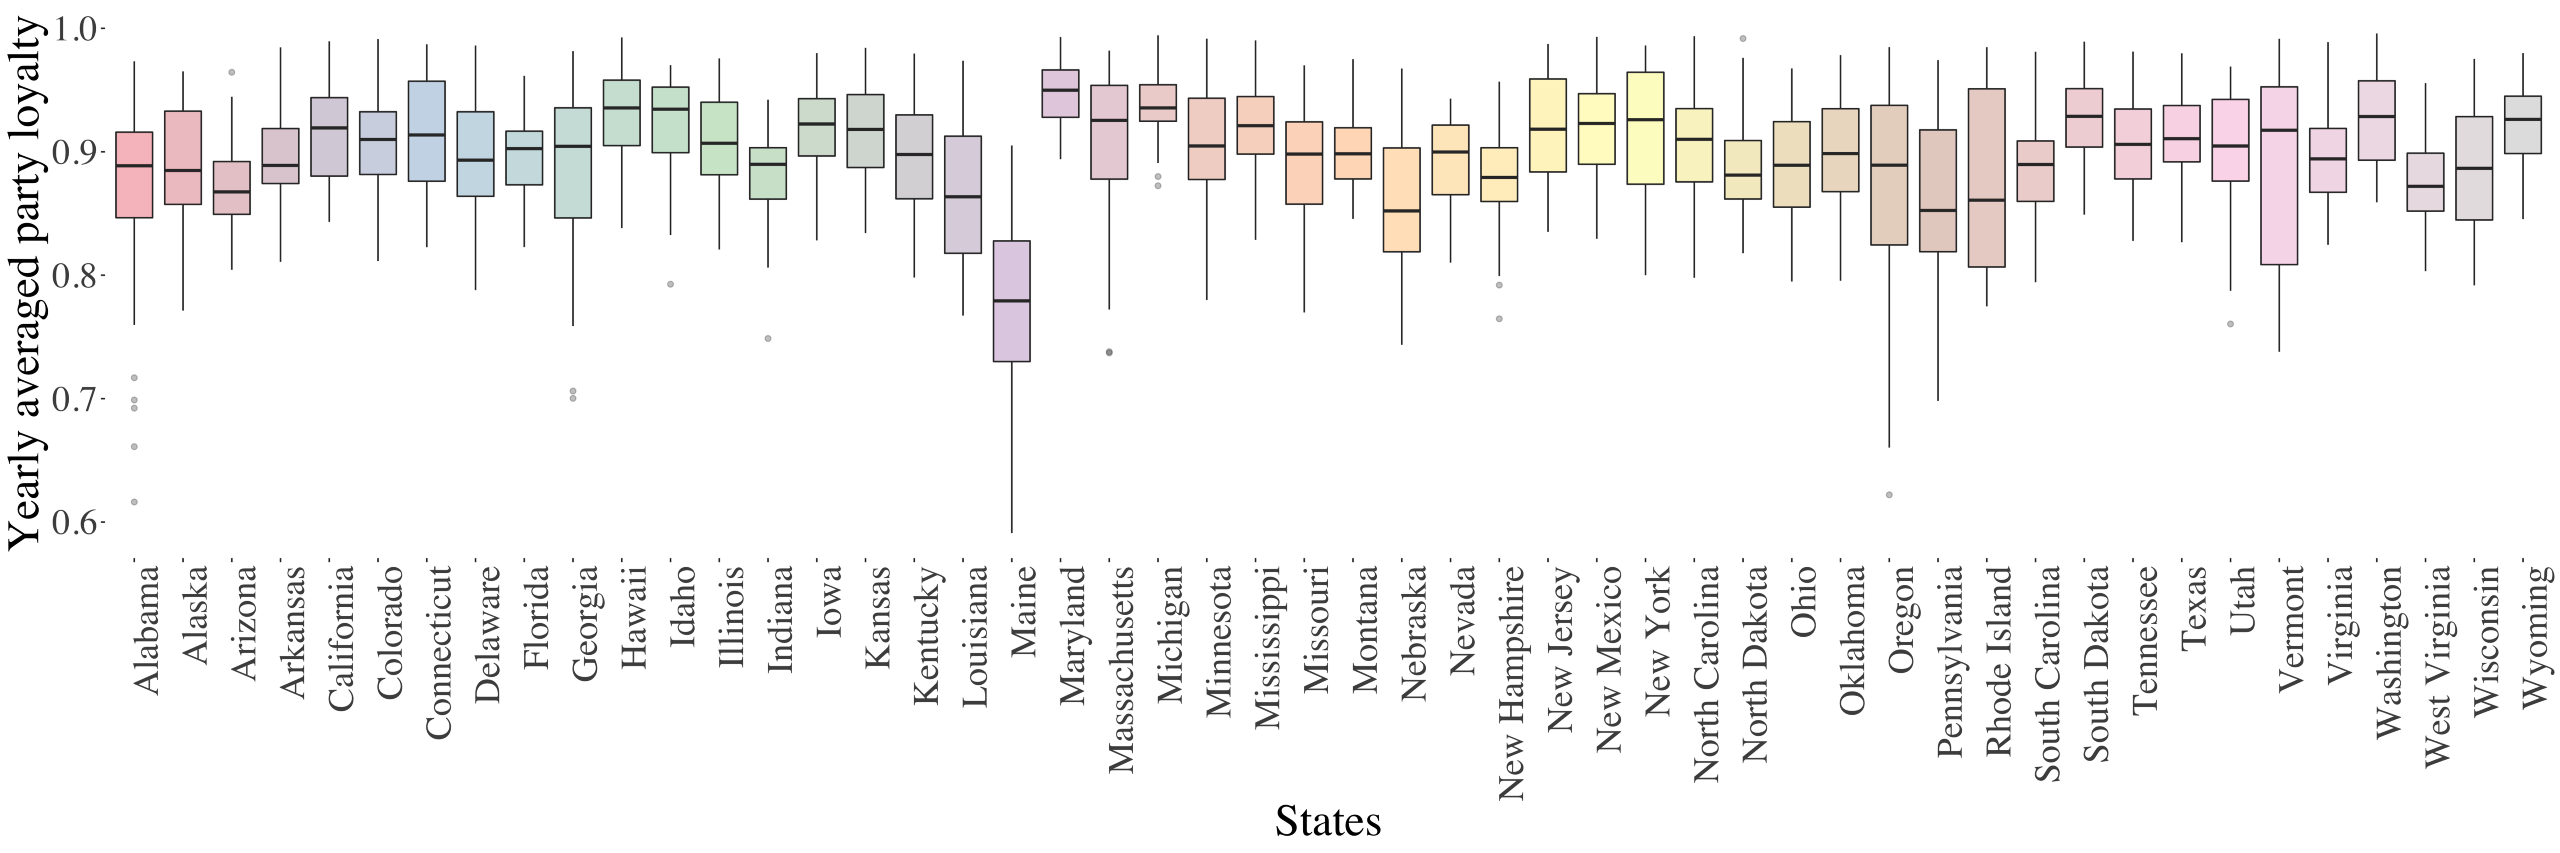
In the chart below we plotted the average party loyalty by state over all the years in our dataset (1989–2020). Even though we find many of the aforementioned states in the bottom half of the chart, the difference between states is not statistically significant between most states.
The aggregated results, averaged over all 30 years for all Senators of both parties, do not show very large differences between the states, with the exception of Maine. This makes sense given the state’s strong history of bipartisanship.
In order to get a better view how the average party loyalty changed over time in each state we look at a dynamic version of the data in the next section.
Looking at party loyalty for all Senators in each state over time gives a much clearer picture and helps us to better understand the rising polarization we see today.
Beginning with the overall trends, it is clear that the entire map has darkened significantly over the period of our data (darker colors = stronger Party Loyalty). This is again in line with our finding shown above that there is a statistically significant increase in party loyalty over this time period. Certain states like Michigan, California, and Washington seem to stay stubbornly dark throughout the time period observed, whereas some surprising states like Nebraska and Alabama have periods where they appear quite light on our map.
In the next section, we investigate some of the “white spots” (states with low party loyality at that time), in hopes that they shed some light on the deepening party loyalty and polarization problem in the United States.
The curious case of Alabama
Starting chronologically at the start of our dataset in 1989, we see something that we would not expect to see in 2020: Alabama as one of the states with the lowest average party loyalty. The state even seems to shine brighter (lighter colors on the graph show a lower average party loyalty) for the first few years of the 1990s, before dimming a bit in 1994, and blending completely in with its dark grey surroundings of other high-loyalty states by 1997.
To understand this change in party loyalty in Alabama over these years, it is important to first understand the history of the Democratic Party, and the party system in America in general. In his book “Why We’re Polarized”, Ezra Klein discusses extensively that throughout much of the 20th century, the two parties were not nearly as polarized as they are today. The average person in the 1950s and 60s had a hard time saying which party was more liberal or conservative. This trend is perfectly encapsulated by the phenomenon of the “Dixiecrat” Democrats, a now defunct political group to which Ezra Klein devotes a chapter in his book. The Dixiecrats were Southern members of the party who were deeply conservative, often white supremicist, and essentially untouchable politically. Political scientists today classify them as political thugs who used dubious means like threatening dissidents to maintain power. For much of the twentieth century, many of them ran race after race unopposed. The slow breakdown of the Democratic party’s power in this region is considered to have begun with Richard Nixon’s so-called “Southern Strategy”, where he sensed an opportunity to win over Southern whites and began to pander to racist fears with his “law and order” policies. This strategy is also in large part responsible for pushing the Republican party further to the right and was one of the first major examples of a campaign pushing for race-based identity politics to influence votes. This was underscored by a statement made by Nixon’s campaign strategist, Kevin Phillips, to the New York Times in 1970:
From now on, the Republicans are never going to get more than 10 to 20 percent of the Negro vote and they don’t need any more than that… but Republicans would be shortsighted if they weakened enforcement of the Voting Rights Act. The more Negroes who register as Democrats in the South, the sooner the Negrophobe whites will quit the Democrats and become Republicans. That’s where the votes are. Without that prodding from the blacks, the whites will backslide into their old comfortable arrangement with the local Democrats. In the quote, Nixon’s political strategist explicitly states the intent of the Republican party to try to tear away Southern white voters from the Democrats.
By the early 1990s, this ideological and identity politics polarization between the parties started by Nixon had continued, and the “Solid South” was quite thoroughly broken apart. At the time when our data starts, Alabama was a last vestige of, and thus very interesting case study for, this phenomenon of shifting party loyalties in the Deep South.
In 1992, Alabama had 2 Democratic Senators: Howell Helfin and Richard Shelby. We will analyze each of them in turn, along with a look at how party loyalty in their state evolved during their time in office.
Howell Helfin was, without a doubt, a holdout from the Dixiecrat era. He was a conservative democrat who strongly opposed abortion and gun control and was in favor of allowing prayer in schools. His uncle, another former Senator from Alabama named James Thomas Helfin, was an avowed white supremicist and member of the KKK who is quoted to have said “God Almighty intended the negro to be the servant of the white man.” It is no surprise, then, that by the time Bill Clinton was running as the Democratic candidate for president in 1992, that Helfin’s views and votes were misaligned with those of his party. In 1996, he chose to retire, and his seat was taken by conservative Republican Jeff Sessions. Jeff Sessions kept the seat until he was selected by Donald Trump to serve as Attorney General in 2016.
Alabama’s other Democratic Senator at the time, Richard Shelby, is actually still in office… as a Republican. In 1994, he switched parties as part of the Republican Revolution, where Republicans gained a substantial number of seats in the midterm elections. Shelby’s switch to the Republican party explains why the state darkens on our map in that year. Helfin’s succession by Jeff Sessions 2 years later explains why it turns fully dark in 1997, when Sessions’ term began.
Loyalty points
It’s clear that Senators from nearly every state, and from both parties, are uniting more strongly with their party and falling in line with how their party votes. For the next stage of our analysis, we wanted to see how this is impacting average tenure in the senate. Do more loyal Senators who vote in line with their party more often stay in power longer?
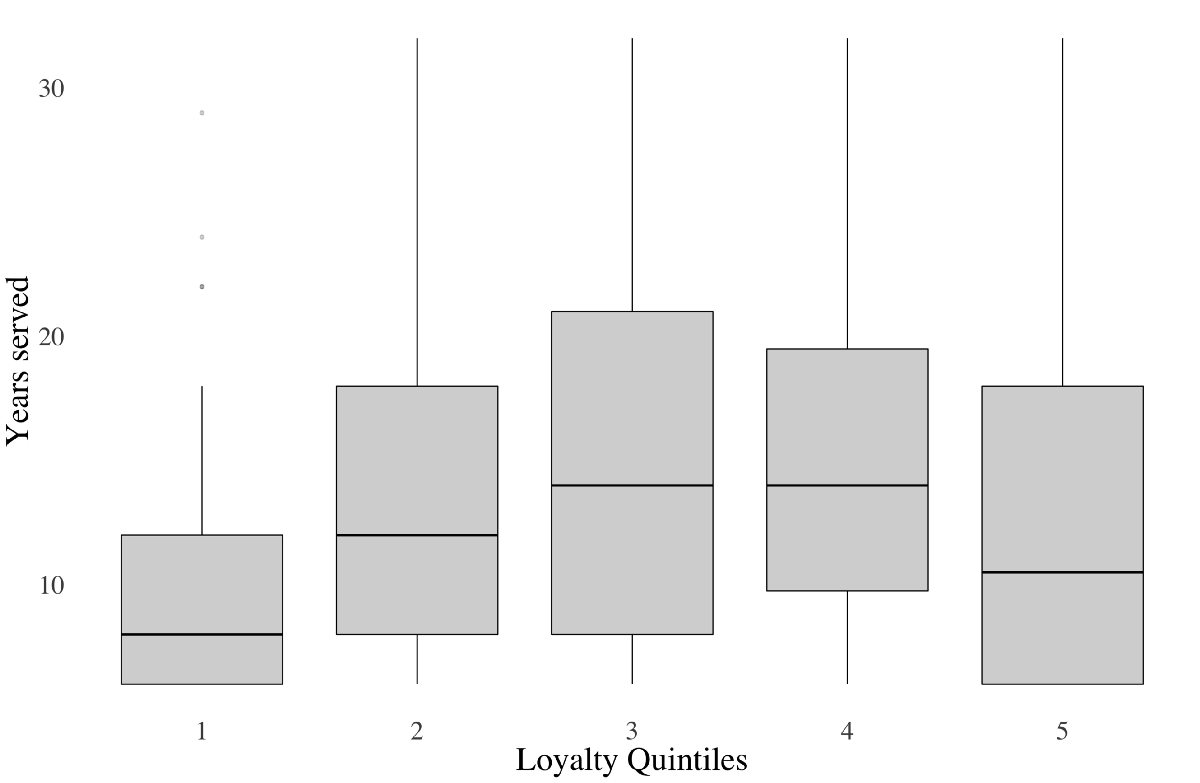
To do this, we looked at tenure for each senator within the time of our dataset. We did not include Senators who served for less than 6 years, as these Senators did not serve a full term.
What we found was that Senators in the middle loyalty quintile - with a party loyalty between .89 and .92 - lasted the longest. This seemed to be the “sweet spot” as far as party loyalty is concerned. Unsurprisingly, if a Senator voted against their party very often (partly loyalty less than .86), like those in the lowest quintile, they averaged less than 2 terms. What is also somewhat surprising, however, is that Senators who are extremely loyal to their party, those in the top quintile (party loyalty greater than .94), also have a shorter average tenure, although they have a wider spread in tenure than those in the lowest quintile.
The tale of 2 Senators
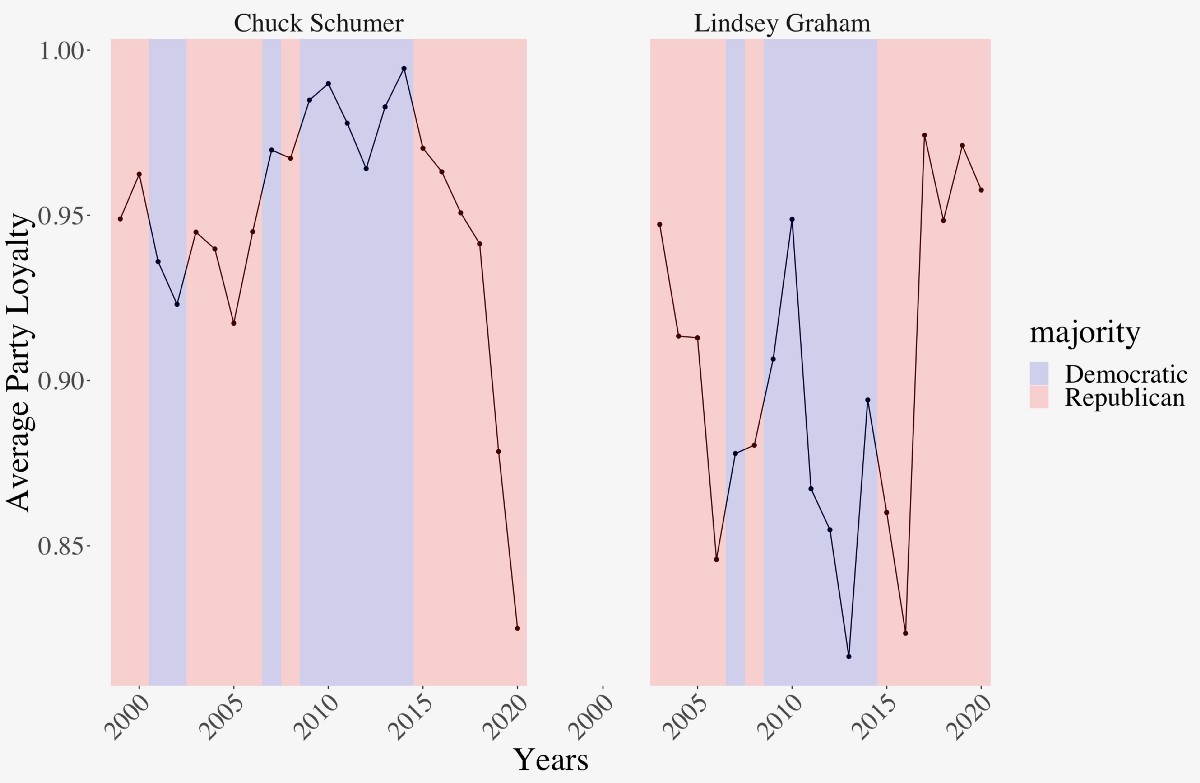
Part of the impetus for us to further explore the effects of polarization and deepening party loyalty in the Senate came from watching a recent debate between Senator Lindsey Graham and his Senate challenger Jaime Harrison. Graham is currently facing one of the toughest fights of his career, and is barely leading his Democratic challenger in the poles. In the debate, Graham laments what he views as the polarization of Senate Democrats when he underscores multiple times how he crossed the aisle to vote for two of President Obama’s Supreme Court nominees. His opponent is quick to point out his change of heart in 2016, however, when he supported Senate Majority Leader Mitch McConnell’s decision not to grant a hearing to Marrick Garland, President Obama’s final nominee. When watching the debate, it was clear from listening to Mr. Graham that his personal commitment to bipartisanship had waned since he reached across the aisle to vote for justices Sonia Sotomayor and Elena Kagan in 2009 and 2010, respectively. This could also be caused by the tougher primary challenge Graham faced in his last Senate race in 2014, including against Tea Party candidates and other pressure from the Right. In 2016, he ran for president and staunchly opposed then-candidate Donald Trump. After Trump’s victory, Graham was forced to change his view, and then became much more aligned with his party. In his current Senate race, Graham’s talking points mainly involve aligning himself with the current president and defending his administration.
As a comparison to Mr. Graham, we wanted to also investigate the changing party loyalty of a high-ranking and long-running Senator on the Democrat side. We chose the current Senate minority leader Chuck Schumer.
As can be seen in the graphs below, Mr.Schumer doesn’t have the same strong swings in party loyalty that can be observed on Graham’s side. Mr. Schumer also reached higher levels of party loyalty than Graham ever did, nearing a party loyalty score of 1.0 during the 2010s. Perhaps the most interesting observation on Schumer’s side, however, is how his party loyalty is actually precipitously decreasing. This could potentially be explained by his position as minority leader - he may feel that he has to lead by example and work across the aisle in his current role. Indeed, a recent investigation from Vox seems to confirm that his commitment to bipartisanship has strengthened since becoming minority leader in 2014. However, there are also signs that his party is tiring with his bipartisanship as it moves further to the left, and that his increasing bipartisanship may put him at risk for a challenge from the more progressive wing of his party in 2022.
This investigation into a high-ranking member of both parties shows that when a Senator has support from their home district, they are more likely to work across the aisle.
Looking at the two graphs above, it might be easy to try to generalize the patterns of Schumer and Graham and think that Democrats became less loyal to their party, while Republicans are the drivers of the problem. The two images below, however, show that this is not entirely the case.
One thing that we notice right away is how many seats the Democrats lost in 2018 - with their map becoming much more grey at that time. Another important takeaway is that there are markedly fewer, where a state has a representative from both parties.
Another striking moment in the images appears on the Republican side in 2017 - the map turns almost completely dark red as Republicans fell in line with their party to pass legislation after the election of President Trump.
These maps separated by party confirm our analysis of Alabama in the grey composite map above showing average party unity across all Senators. The light color, representing low party unity, of the country is seen very clearly during the years only on the Democratic map. When Richard Shelby changed party in 1995 (the first Congress after his election in 1994), the state turns quite dark red on the Republican side of the map, while the Democratic side stays fairly light. In 1997, when Jeff Sessions joined as Senator, the state falls off the Democratic map and turns even darker red on the Republican side.
Nebraska once again shines as a light state at many points on our map, likely because it is at many points a purple state with one Senator from each party.
Looking forward
What will these trends look like in the future? Will our polarized 2-party system continue to worsen, leading to ever more stalemates, government shutdowns, and drastic policy swings between parties in power? It can be easy to assume so when looking at the information we’ve presented here that we are heading towards a further polarized outcome.
However, that is certainly not the only possibility. The electoral map is changing, and many red states that were previously untouchable by democrats, like Texas and Georgia, are now very much in play. If bigger states like these switch from red to purple, it could force their incumbent politicians to move towards the center. Similarly, it’s likely that new politicians they elect will be more moderate. This has already been seen with cases like Kirsten Synema in Arizona, a formerly red state that has since turned purple.
This year’s presidential election will also offer clues as to where our political polarization is headed. Voters in the Democratic primary rejected further polarization of their party when they selected moderate Joe Biden to be their nominee. If Joe Biden is able to pull off wins in swing states like Iowa, North Carolina and Pennsylvania, this could also signal a tend away from polarization in the future.