Using Python to do Your Homework
Applying OpenCV and Tesseract to do your math-homework
The possibilities to use Python are almost endless - repetitive tasks especially can be solved easily using Python. Here we show how Python can be used to automatically answer problems on a math worksheet.
First we take a look at the math questions:
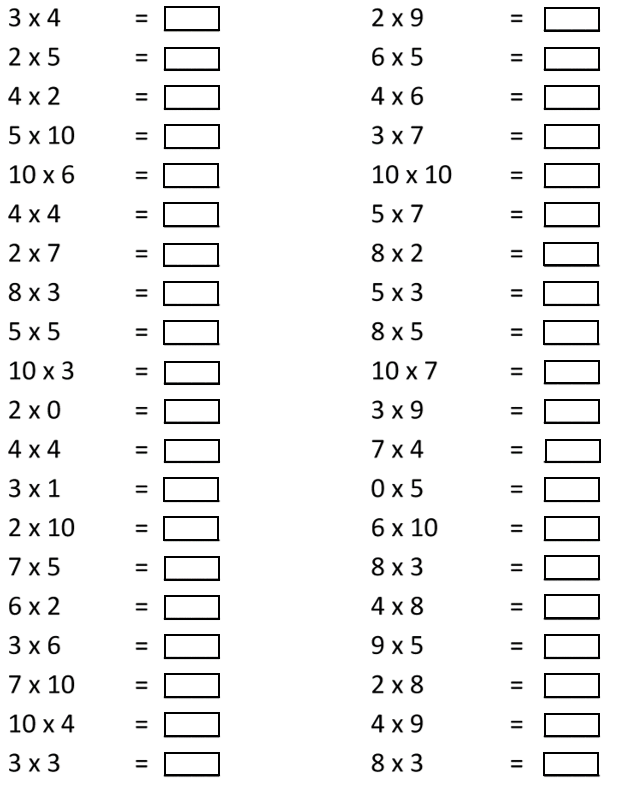
Nothing too difficult, but the amount of questions could make it very tiring to solve and fill in every single one. Instead, let us try it in Python!
We start by importing the relevant packages. In fact, we need exactly three packages. The first package enables us to read the questions, meaning it transforms image to text. The package we are talking about is called pytesseract. It is important to note that a bit more work than only pip install … is required to get it running. Here is a link to a good tutorial regarding this problem.
The second package is necessary for finding where exactly the solution should be written. This means we have to tell the machine that the answer of every equation should be written in the black squares next to the equation. In order to find and identify these squares, OpenCV is needed.
Last but not least we import a package which is able to handle strings or regular expression operations, called “re” for short.
import pytesseract as tess
path = (r"C:\Users\PaulM\AppData\Local\Tesseract-OCR\tesseract.exe")
tess.pytesseract.tesseract_cmd = path
import cv2
import re
01 Reading the questions
We start by importing the picture and apply the image_to_string function from tesseract
png = "{}\questions.png".format(raw_path)
text = tess.image_to_string(png)
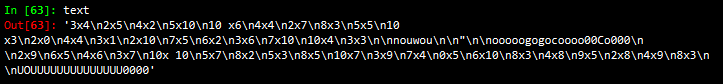
Looking at the results below, it seems at first glance that everything worked succesfully. Our result is one big string where each equation is delimited by a line break, which is denoted as a \n symbol.
However, a bit more cleaning is still necessary before doing the calculations. First we have to remove all spaces between numbers and then figure out which part of this string represent actual questions. This is done with the following three lines of code:
text.replace(" ", "")
pattern = re.compile("[0-9]+x[0-9]+")
equations = [x for x in parsed_text if bool(re.match(pattern, x))]
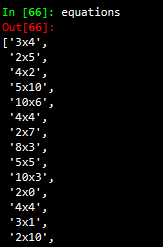
The last line of the code above is filtering the long string shown above and only extracts a certain string pattern. Specifically, it extracts an undefined amount of numbers (denoted as [0–9]+) then the letter x and then again an undefined amount of numbers. The result of that code is a list which contains all equations.
The last step is probably the easiest, namely to calculate the solutions of all the equations. For this we build a small function, which is then used within a list comprehension to solve the equations.
def multiplication (equation):
    split_equation = equation.split("x")
    num1 = int(split_equation[0])
    num2 = int(split_equation[1])
    return str(num1 * num2)

solutions = [multiplication(x) for x in equations]
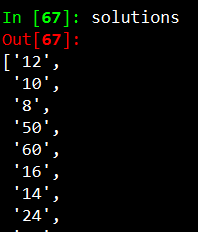
The result of this function is the solutions of all questions. In total we end up with a list with the length of 40, which is the exact number of questions on the sheet.
02 Processing the image
The next step is now to fill in the solutions back on the questionnaire. This sounds easier then it actually is. To fill in the answers on the sheet, we have to find a specific location on the png where we want the solution to be written. In our example, we would like to find the coordinates of the black answer box which is next to every equation.
We start by reading in the image using OpenCV. Next, we transform the picture into a gray-scale format. This is done in order to compress information. Since we would like to identify a certain shape on an image, colors are not important to us and we can move from a tensor to a matrix.
raw_img = cv2.imread(png)
img = cv2.imread(png, cv2.IMREAD_GRAYSCALE)
Let’s take a look on how the output of the gray-scale looks like. The Gif below nicely shows that we now have a large matrix containing all the pixels of the picture. We can see that most of the picture is covered with white pixels (white encodes to the integer 255). Furthermore, we can even read the equation, the equal sign, as well as the answer box ny looking at where the pixel number and color changes.
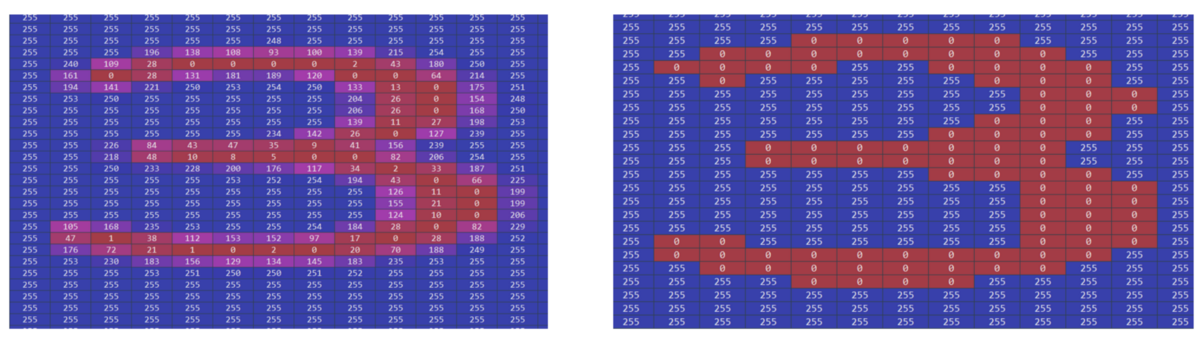
The pixels representing the answer box are of particular interest to us, since we would like the answer to be placed within it. Before continuing to identify the box, some pre-processing is necessary - namely to enhance the contrast between the box and the white background for better identification of the shapes, a process called thresholding. An example which exemplifies the need to do that, is shown below. On the left side we have the number three shown from the initial image, whereas on the right side we have the same number after applying the thresholding.
As can be seen below, a written number is not entirely black. Especially on the sides the strength of the ink fades out. In order to make it easier for the computer to identify clear shapes, like a square for example, we turn every pixel below a certain threshold black and the rest white.
img = cv2.imread(png, cv2.IMREAD_GRAYSCALE)
_, threshold = cv2.threshold(img, 170, 255, cv2.THRESH_BINARY)
The code above shows how this step was implemented. The first line reads in the png we imported at the beginning and directly transforms it into a gray-scaled picture. The second line then applies the thresholding to the gray-scaled image. This is done by specifying the image, the threshold value (in our case 170, which is obtained by trial and error), the maximum value (in our case we would like the pixels to turn white if the exceed the threshold), and the way OpenCV should apply the thresholding. Binary thresholding means that there will be a clear cut - every pixel with a value below the thresholding will be set to zero, every pixel above the threshold will be set to the maximum value, in our case 255.
The next step is then to identify the squares within our image. This is done by the handy function called findContours
contours, _ = cv2.findContours(threshold, cv2.RETR_TREE,
                               cv2.CHAIN_APPROX_SIMPLE)
We see that the function takes three inputs (it thas more arguments than that, but these three are relevant for our problem). The first input represents our thresholded image. The second input is not of great importance to us, since it states which kind of hierarchy should be used when storing the contours. The third output defines how a shape should be saved.
The image below shows this last point visually. Even though we have two white squares, there are two different in which we could save the relevant information needed to replicate these squares: we could either save every single pixel, as it is done in the left picture, or we save only the corner coordinates. Needless to say, the right one would use significantly less memory. Exactly this method is specified when the cv2.CHAIN_APPROX_SIMPLE in the command above was called.

03 Inserting the solutions
After storing all the information of all kind of shapes from the picture, we would like to restrict the shapes we are looking for to the squares. As outlined above, we stored the information of every shape by storing the coordinates of the corner points of every contour. Since we are interested in squares, only contours which have exactly four corner points are relevant for our problem.
rectangles = [x for x in contours[1:] if (len(x)==4)]
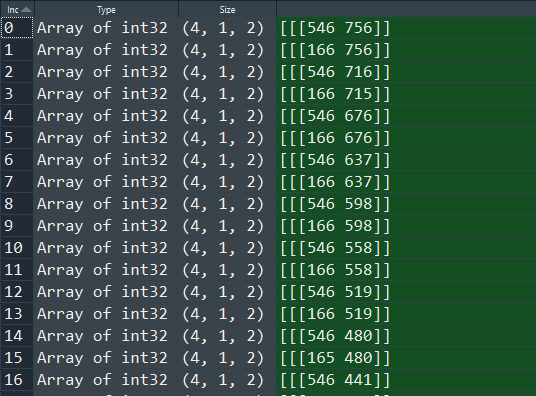
One not very intuitive feature of the OpenCV function findCountours is that it detects contours from right to left and from bottom to top. This created a bit of a problem, given that we our solutions are stored in a different way, namely from top to bottom and left to right. In order to align these two lists, we alter the rectangles list we created in the code above through the following code
right_side = list(reversed(rectangles[0::2]))
left_side = list(reversed(rectangles[1::2]))
sorted_list = left_side + right_side
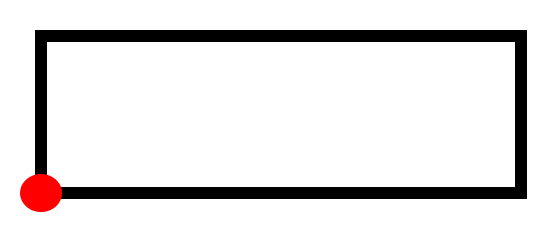
Now the solutions as well as the rectangle information are both in same order. Last but not least we then have to write the solutions into the rectangle. This is done by extracting the bottom left x and y coordinate, which is shown in the image below as the red circle.
The actual writing of the solution for each question is done by a function called putText. The input of the function are relatively straight forward. Namely, we insert the image as well as some coordinates and a font.
font = cv2.FONT_HERSHEY_COMPLEX
for i, j in zip(solutions, sorted_list):
    x = j[1][0][0]
    y = j[1][0][1]
    cv2.putText(img, i, (x, y), font, 0.7, (0))
cv2.imshow("Threshold", img)
cv2.waitKey(0)
cv2.destroyAllWindows()
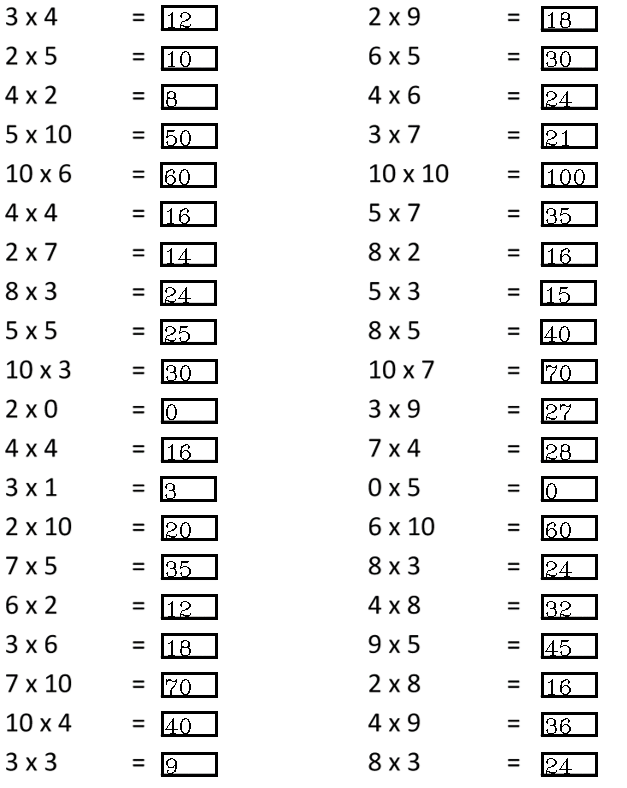
Finally we then can display our results, which look very promising. It might be that solving these question by hand instead of using Python could have been quicker, but it would have been considerably less fun!