

Conclusion - Predicting Real Estate Prices with Features Scraped from the Web
What we learned predicting real estate prices with data scraped from the web.
We started this data science project with a seemingly simple question — “What is the price of this property? How can we improve our price estimations?”
The past articles in this series have shown the work needed to answer this question. After gathering data from real estate web advertisements using web scraping, a significant amount of time was spent cleaning the data and extracting the features needed for modeling.
We tested multiple variations of regression models, including Random Forests, Adaptive Boosting, and XG-Boost. XG-Boost was the clear winner and the algorithm used for all later modeling. All MAPE values shown were calculated with the holdout test data.
We started with an initial baseline XG-Boost model using the features that were easiest to extract from the scraped website advertisements. This model had roughly a 24% MAPE on price quintiles 9–10, but a MAPE of over 50% on the lowest priced houses.
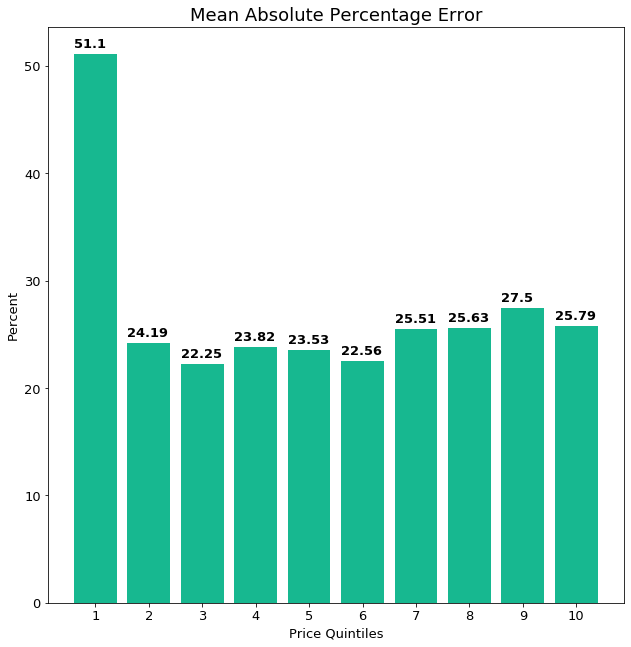
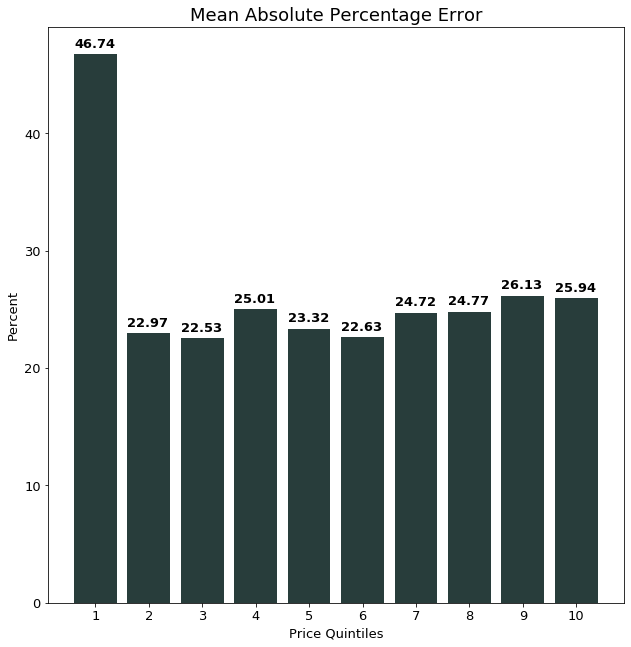
We showed that this much larger error in the first quintile was likely caused by the lower variance in the feature data, yet relatively higher variance in the target variable, for this quintile. We also showed how taking the log value of many of the continuous numeric features and re-training the XG-Boost improved the predictions in the lowest quintile by about 7%, though it did not significantly change the errors in the other quintiles.
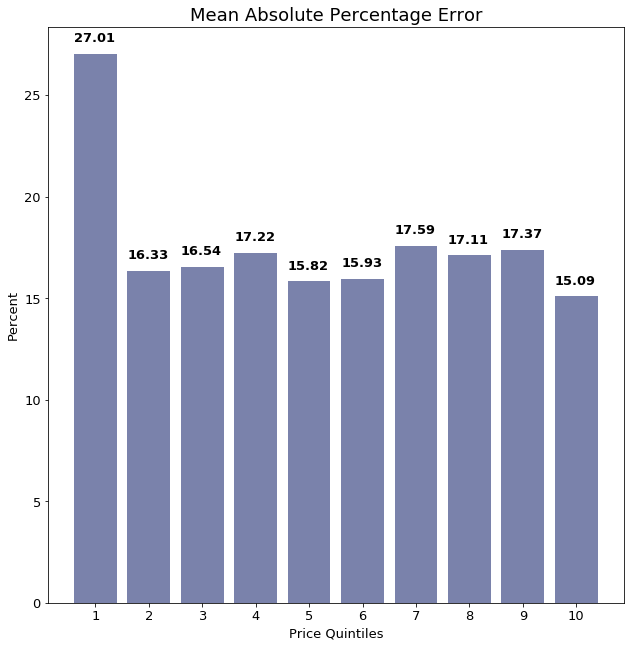
After these improvements were made, we shifted our focus to extracting more features from the advertisement’s description text. We used a TF-IDF vectorizer to extract features from the text and added these features to the logged features. This significantly improved the performance of the model in all quintiles, but most significantly in the lowest price quintile, where MAPE improved by about 19%.
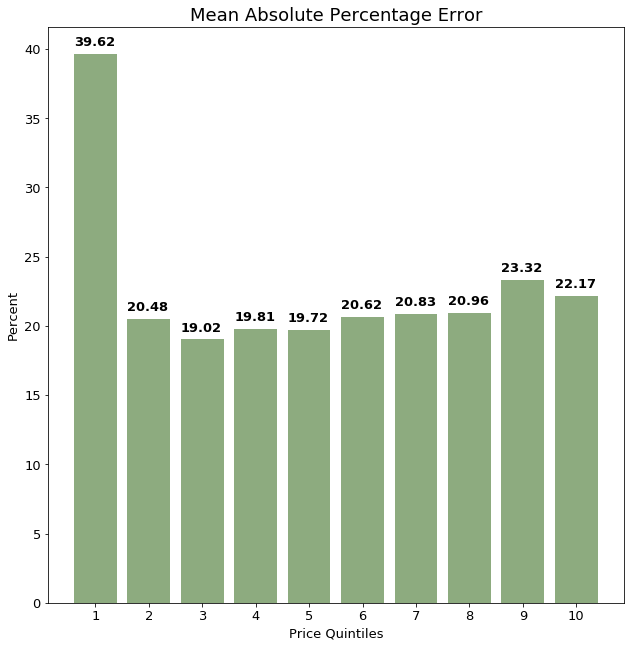
Finally, we tried reducing the dimensionality of the NLP feature vector using principal component analysis, PCA. The model trained with logged features and the 8-feature PCA representation of the text features still outperforms the model trained only with logged features, but underperforms compared to the model with all 158 text features.
Final model selection
Many models using different combinations of features were trained for this project — it is helpful to compare them side by side.
Below is a table showing the MAPE for each price quintile for all models discussed above.
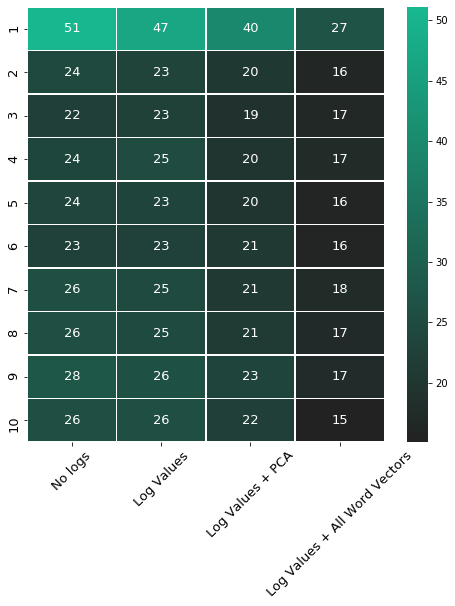
Here, the almost 50% improvement between the original baseline model (No logs) and the final model (Log Values + All Word Vectors) can be clearly seen. Overall MAPE is less than 20%, compared to our initial overall MAPE which was nearly 40%.
To put this into perspective- in the lowest quintile, a house may cost €50,000. Our original model would, on average, predict this house with a 50% absolute error, meaning it would predict either €25,000 or €75,000 for this house. The final model, with MAPE of 27%, in contrast, would predict either €36,500 or €63,500 — both much more reasonable and closer to our real target value.
For the top quintile, the results are even more exciting, as the model predicted throughout model configuration better for the more expensive estates. An estate in the highest quintile of our data cost around €1,500,000. The final model MAPE for the highest quintile is 15%. Hence, the model would on average predict something between €1,275,000 and €1,725,000, which is not a bad prediction at all.
With our final model, and the data understanding we’ve gained throughout this project process, we can now answer our original question of which factors are most influential in predicting the price of Spanish real estate, and how we can improve our estimation.
The features bedroom and bathroom were highly correlated, so when both were included in the model, bathroom was much more important. Square meter of the flat was also very important, followed by distance to various sized cities. Improving the features by taking the log of most continuous variables further improved predictive power, and including descriptions that gave insight into the condition of the property and further amenities greatly improved the model.
Caveats
On the last note, it is important to stress the nature of real estate pricing, which is more an art than an actual science. Just because a house is on the market for a certain price, does not mean that this price is in any way correct. Most house prices are subjectively chosen by real estate agents and/or home owners. It is also very likely that different agents would assign quite different prices for the same estate. Any type of prediction model would have problems to capture this kind of sentiment in the target variable.
Another problem is the selection bias we encounter by scraping the data from the web. Imagine the following: A proud home owner decides to sell her house. After talking to multiple real estate agents she thinks that she truly knows the worth of her house when putting a price tag on it. After she left the computer, her kid puts his little bungalow, which is located in the front yard of the house, on the web for the very same price, just as he saw his mom do. Since the actual house was very reasonably priced, it got sold soon after being put on the market. After it got sold, the ad was also taken down from the web. The little bungalow, on the other hand, will be on the web forever, waiting to mess with the data of some data scientists.
This illustrative example underlines two points: First, the data we used to train our model can, even after initial outlier detection, still be very biased and full of the aforementioned completely unreasonably priced bungalows. Secondly, the final prediction could also well be the true value of the estate. A real estate agent does not run any model to come up with a price but rather uses his/her gut-feeling.
Learnings & Next Steps
Overall, we are very happy with our final model’s performance, especially on the more difficult to predict lowest quintile. The inclusion of NLP features and logging high-variance continuous variables drastically improved our model’s performance.
That being said, there are still additional features and methods we would like to try that we think could further improve the model’s performance.
One additional feature we would like to add would be to include a more explicit representation of location — one that more directly impacts price. We realized especially after plotting the latitude and longitude data and seeing how the properties in the Canary Islands skewed the latitude and longitude data. This feature could be a ranking of each town or city based on average price in the city. For example, a more expensive city like Barcelona would receive a high ranking whereas a small town in the mountains would recieve a low ranking. Adding such a feature would also not increase dimensionality of the data.
Concerning the process of the project, we were happy with how it proceeded. We trained baseline models very quickly and used these results to inform practical improvements. We visualized often and at every stage tried to further increase our understanding of the problem and factors influencing the model’s performance. We pivoted quickly if it looked like a new feature or approach wasn’t working and always kept the main question in view.
The next step for us is to deploy the model so that it can predict on new data. Model deployment can take a variety of forms. One option would be an API, for example in a simple cloud-based web service. A further step would be to build an interactive front end to this API. Further next steps involve taking the knowledge gained in this project to future data science projects, and incorporating feedback from this project and further reflection.
Get in touch
If you’re interested in this project, have a question for the authors, or would like to discuss the methodology, get in touch at data4help.contact@gmail.com.